
For a Seattle marketing agency, a custom reporting dashboard almost always beats manual client reports on the numbers that decide your margin: it replaces hours of monthly copy-paste with a live, branded page every client can log into — instead of someone on your team rebuilding the same deck by hand from Google Ads, Meta, GA4, and Search Console every month. Manual reporting is a cost that scales linearly with your client count; a custom dashboard is a one-time build that then runs for free across your entire book. At the U.S. median wage of $37.00/hour for a market research analyst (U.S. Bureau of Labor Statistics, May 2024), even a conservative reporting habit quietly costs a 15-client agency around $20,000 a year — and worse, it’s the exact work that decides whether clients renew.
I spent eight years running fulfillment for a 40-client SEO and PPC shop, and reporting was the task everyone hated and nobody could kill. It’s the boring half of agency life where margin leaks out one pasted screenshot at a time. This is the operator’s breakdown — what manual reporting really costs a Seattle agency, what a custom dashboard replaces it with, and how to decide which one your agency should be running in 2026.
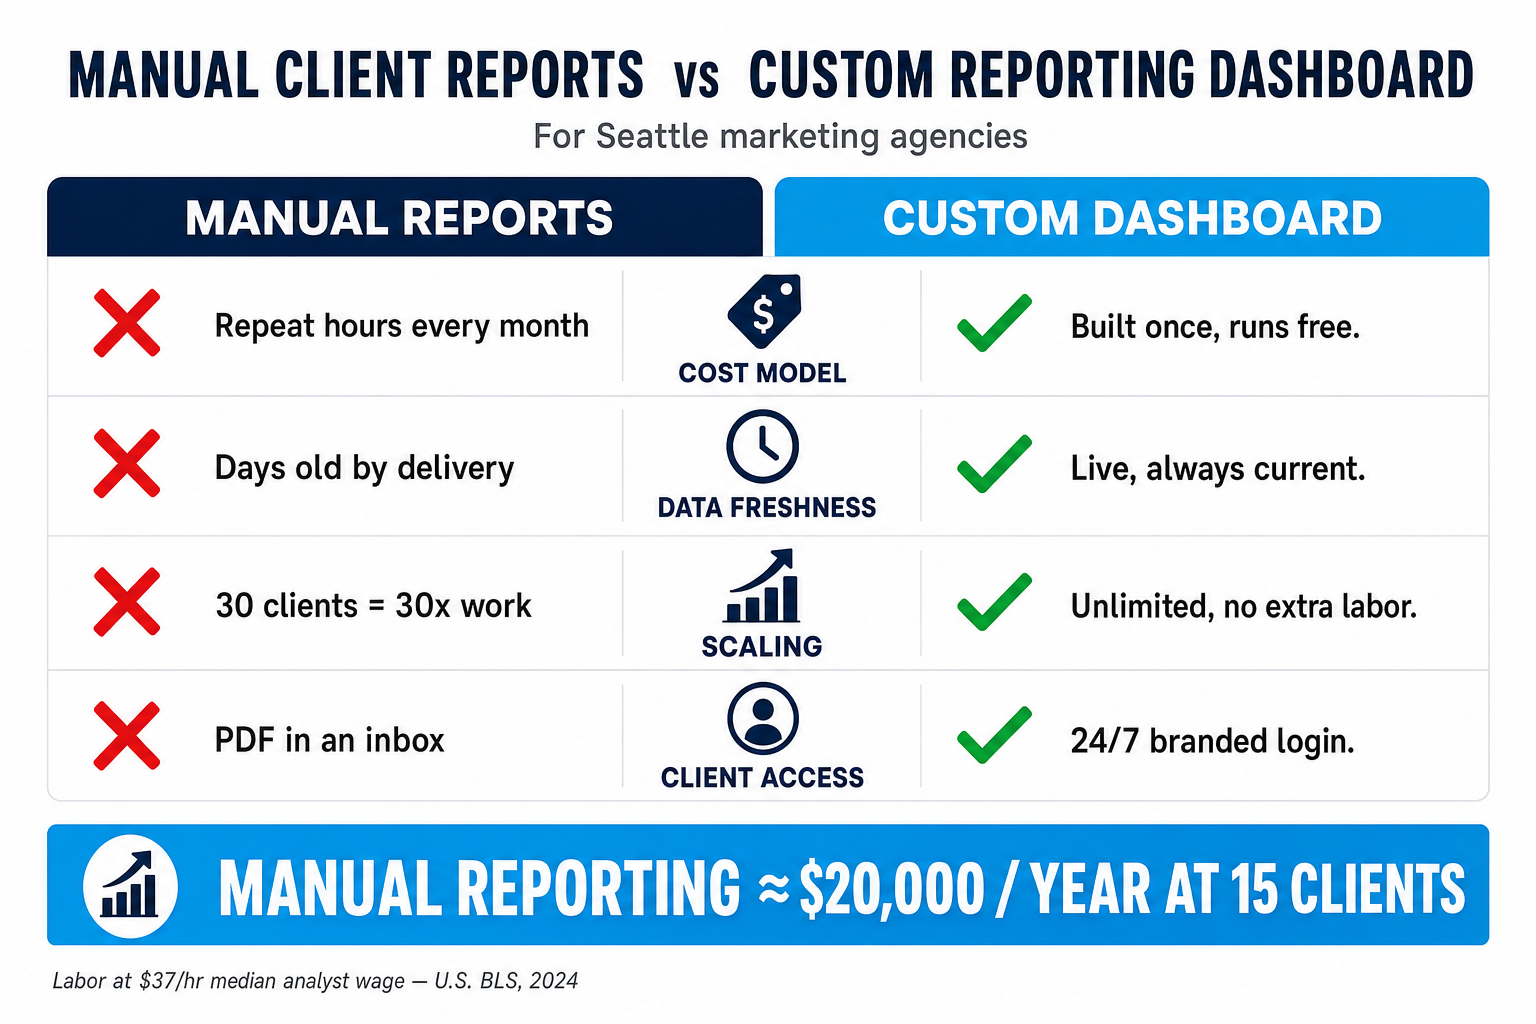
Table of contents
- The short answer
- What “manual client reporting” actually costs
- What a custom reporting dashboard is
- Manual reports vs. a custom dashboard, line by line
- The hidden cost: reporting is a retention system
- When manual reporting still makes sense
- How a custom dashboard gets built
- Why this matters more for Seattle agencies
- FAQ
The short answer
If your agency has more than a handful of retained clients and someone is manually building reports every month, a custom reporting dashboard will almost certainly pay for itself — usually within the first year — by giving those hours back and making your value visible enough to defend the retainer.
Manual reporting loses on three axes at once: it’s expensive (real labor hours, every month), it’s slow (the client sees last month’s numbers, days late), and it’s fragile (a pasted number gets stale or wrong, and the report only exists when someone has time to make it). A custom dashboard wins on all three — live data, always current, always available — and it stops being a per-client cost the moment it’s built. The one place manual reporting still holds up is at very low volume, which we’ll cover below.
What “manual client reporting” actually costs
Manual reporting rarely shows up as a line item, which is exactly why it’s dangerous. Nobody invoices “four hours rebuilding the Meta slide,” so the cost hides inside salaries and stays invisible until you actually add it up.
Here’s the honest math. A typical monthly client report pulls from four, five, or more platforms — Google Ads, Meta Ads Manager, GA4, Search Console, and often a call-tracking tool like CallRail — each exported, reformatted, and pasted into a branded deck. That fragmentation is the whole problem: marketers already juggle an average of 15 data sources, up from 10 the year before (Salesforce, State of Marketing), and reconciling them by hand is exactly the work a report demands. Even a fast operator spends a conservative 3 hours per client per month doing it well: pulling data, sanity-checking numbers, writing the summary, and formatting the slides.
Average number of data sources marketers pull from, per Salesforce’s State of Marketing (10, rising to 15, with 18 expected). Source: Salesforce, State of Marketing.
Now price the hours. The U.S. Bureau of Labor Statistics puts the median wage for a market research analyst at $37.00 per hour ($76,950/year) as of May 2024 (BLS). Run that across a book of clients:
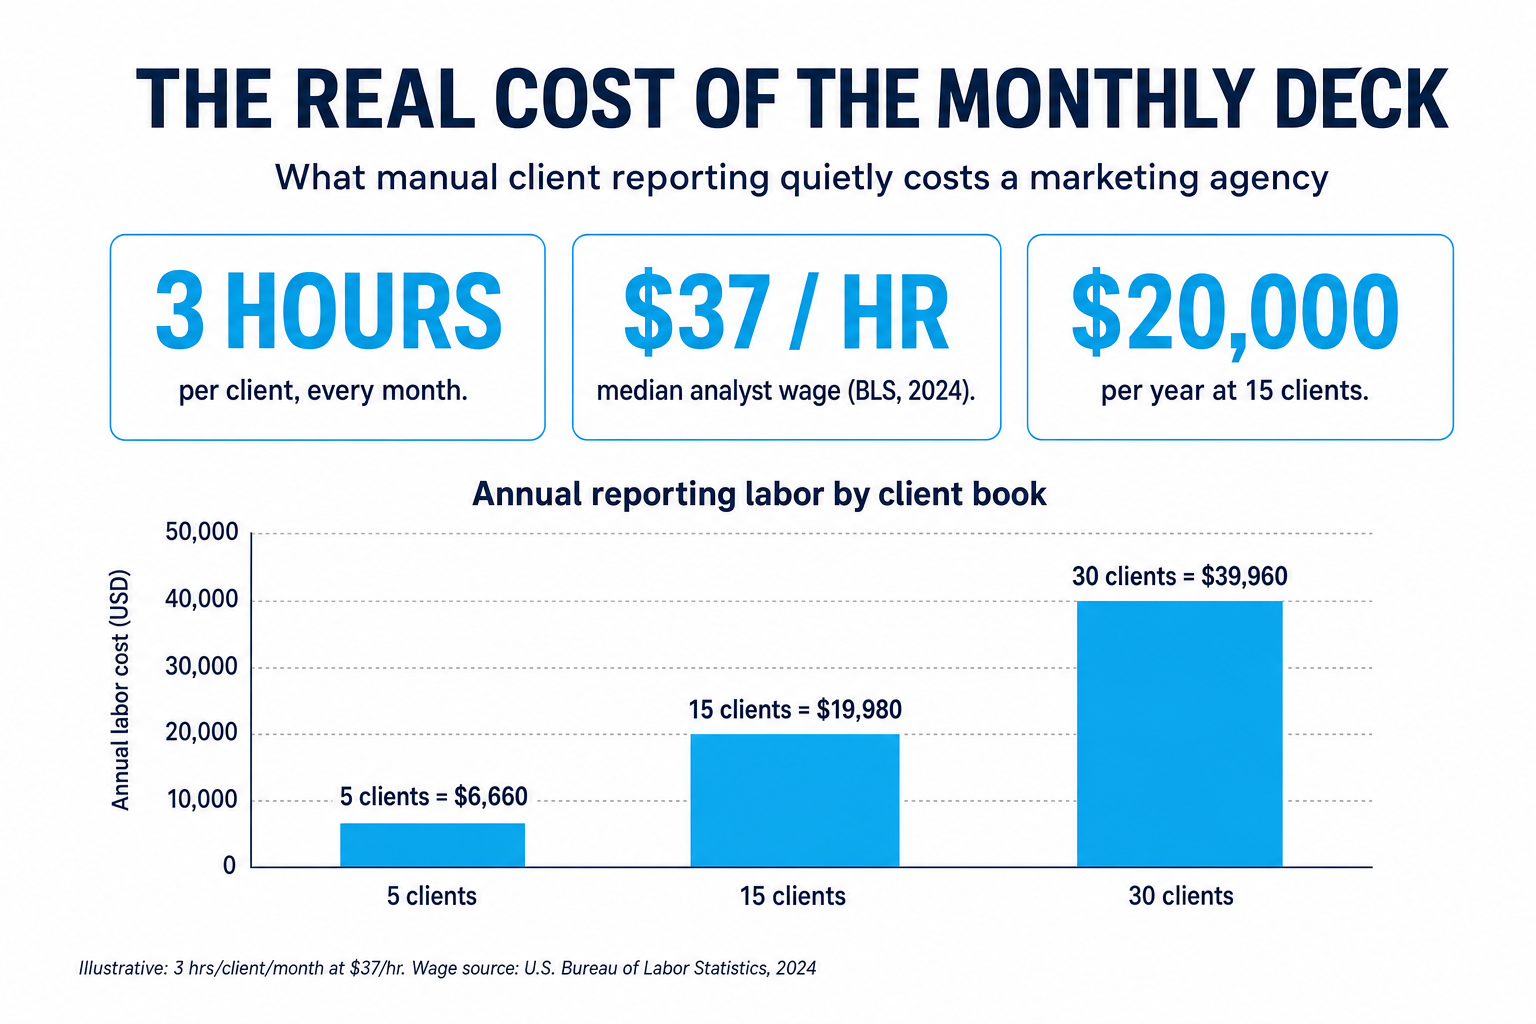
At 15 clients, that’s roughly $20,000 a year and 540 hours — about 13 full 40-hour work-weeks — spent assembling reports that a dashboard could generate on its own. And 3 hours is generous to the manual side; the moment a client asks “can you break that out by campaign?” or a data source changes its export format, the real number climbs. This is the leak the 2026 agency benchmarks keep pointing back to: the busywork that eats margin isn’t the creative, it’s the operations around it.
There’s a second, sneakier cost, too. The person building those decks is usually one of your more capable people — the analyst or account manager who could be optimizing campaigns or having a renewal conversation. It’s an industry-wide pattern: data professionals spend around 45% of their time just getting data ready — loading and cleaning it — before any actual analysis happens (Anaconda, State of Data Science). In an agency, that “getting the data ready” is your reporting process, and every hour of it is an hour not spent on the work that actually grows the account.
What a custom reporting dashboard is
A custom reporting dashboard is a branded web page — on your domain, in your colors — that pulls live data from the ad and analytics platforms your clients care about and displays it automatically. Instead of a PDF that lands in an inbox once a month, each client gets a login where they can see leads, cost-per-lead, ROAS, rankings, and spend updated on their schedule, not yours.
The key difference from an off-the-shelf reporting tool is that it’s built around how your agency actually works — your metrics, your definitions, your white-label branding, your client roster — and you own it outright. It connects directly to the Google Ads, Meta Ads Manager, GA4, Search Console, and CallRail APIs, so the numbers are never pasted, never stale, and never wrong because someone was rushing before a call.
This is squarely in the territory of custom software for agencies: a live client reporting dashboard is one of the most common builds precisely because the ROI is so easy to see. It’s a close cousin of a white-label client portal — one login where the client can always see the value you’re delivering.
Manual reports vs. a custom dashboard, line by line
Here’s the honest head-to-head. Manual reporting isn’t “wrong” — it’s just a model that gets more expensive with every client you add, while a dashboard gets cheaper per client the more you have.
Manual client reports vs. a custom reporting dashboard
| Plan | Manual client reports | Custom reporting dashboardRecommended |
|---|---|---|
| Price | Recurring hours, every month | One build, then near-zero |
| Feature 1 | Costs the same labor per client, forever | Built once, runs across every client |
| Feature 2 | Data is days old by the time it's sent | Live data, always current, self-updating |
| Feature 3 | Human error: stale, mistyped, or missed numbers | Numbers pulled straight from platform APIs |
| Feature 4 | Only exists when someone has time to build it | Available 24/7 on a login clients control |
| Feature 5 | Scales linearly — 30 clients = 30x the work | Scales to unlimited clients at no extra labor |
| Feature 6 | Lives in a PDF the client may never open | Branded page that proves value on demand |
| Get a dashboard built → |
The pattern is the same one behind every good agency automation: replace repeated manual labor with a system you build once and run forever. The manual report is fine at three clients and quietly brutal at thirty. Look at the labor curve against the flat cost of a build:
Illustrative monthly reporting labor for a 15-client agency: ~3 hours per client manually vs. near-zero once a live dashboard is generating reports automatically (a couple of hours for spot-checks and commentary). Based on 3 hrs/client/month at the BLS median analyst wage.
The hidden cost: reporting is a retention system
The cost of manual reporting isn’t only the hours — it’s what bad reporting does to churn. And churn is the number that actually decides whether a Seattle agency grows.
Start with the uncomfortable benchmark: in research cited by HubSpot, 50% of marketing decision-makers said they’d fired an agency in the prior two years, and the top reasons were a perceived lack of results and poor communication — not the quality of the work itself (Agency Management Institute, via HubSpot). Reporting sits right on that fault line. When the report is late or confusing, “we can’t see what you’re doing for us” becomes “let’s look at other agencies.”
The reporting-specific data makes it concrete. Roughly 43% of digital marketing clients are unhappy with the reports their agency sends, while agencies that consistently delivered data-backed proof-of-performance reporting saw client retention climb 51% over 24 months (Vendasta). Same work — made visible — kept clients more than half again as long.
Now stack that on the retention economics. Bain & Company’s foundational work found that increasing retention by just 5% increases profits 25% to 95% (Bain & Company), and retainer relationships already churn far less than project work — about 18% a year vs. 42% for one-off projects (Focus Digital). A dashboard that keeps your value visible every day isn’t a nice-to-have; it’s leverage on the single most profitable number in your business. That’s the same logic behind stopping churn with reporting clients actually read and tying outcomes to your work with lead attribution that proves ROI.
And remember the margin backdrop: the average digital agency ran only a ~13% net margin in 2025 (Promethean Research). When margins are that thin, a $20,000/year reporting leak — and the churn that invisible reporting causes — isn’t a rounding error. It’s the difference between a good year and a flat one.
When manual reporting still makes sense
To be fair to the manual side: a custom dashboard isn’t the right first move for everyone. If you have one to three clients, the build cost won’t pay back quickly enough — a clean template and a disciplined monthly cadence is genuinely the better call while you’re small. The same is true if your clients are on wildly different, one-off stacks with no shared metrics, or if you’re still figuring out which numbers actually matter to your niche.
The tipping point is roughly where the annual labor of manual reporting approaches the one-time cost of a build — and where reporting has become a real drag on your team or a real risk to retention. For most agencies with a growing retainer book pulling from the same handful of platforms, that point arrives faster than they expect. If you’re not there yet, automate what you can inside your existing stack (scheduled, white-labeled reports are one of the systems that ship in the Digital Marketing Snapshot) and revisit a custom build when the client count crosses the line.
How a custom dashboard gets built
The build itself is more approachable than most agency owners assume. A client reporting dashboard is a well-trodden project: connect the platform APIs, model the metrics, design the branded front-end, add client logins and roles, and schedule the data pulls.
On our side, these are built with Claude Code — Anthropic’s AI-assisted development CLI — so a small senior team ships roughly 10× faster than a traditional dev shop typing it line by line. In practice, a client reporting dashboard lands in about 4–6 weeks, fixed-price projects run $3K–$50K+ depending on scope (or $75/hour on an hourly retainer), and every fixed-price build includes a 30-day bug-fix warranty. The output is 100% yours — no per-seat SaaS fees stacking up as you add clients.
If your reporting also needs to read from or write back into GoHighLevel — pulling pipeline and attribution data alongside ad metrics — that’s a GHL development build, and many agencies need both a standalone dashboard and a GHL integration working together. Either way, the goal is the same: kill the monthly deck and give your team its hours back.
Why this matters more for Seattle agencies
Seattle is a demanding market to run an agency in. It’s the largest city in Washington with more than 740,000 residents (U.S. Census Bureau), a tech-heavy economy, and a client base that expects software to be modern by default. A Seattle client who works at a company with a live analytics dashboard on every internal screen is not going to be impressed by a PDF that arrives five days late.
That expectation cuts two ways. It raises the bar — a clunky monthly report reads as behind-the-times to a Seattle buyer faster than almost anywhere else. But it also rewards the agencies that show up modern: a branded, always-on dashboard signals that you operate like the tech companies your clients admire, and it quietly out-positions the shop down the street still emailing screenshots. In a market this competitive and this expensive to staff, the agency that spends its senior hours on strategy instead of slide-building wins on both margin and retention.
The through-line is the one every profitable agency eventually learns: the work that grows an agency isn’t the reporting, it’s what reporting frees you to do. Build the system once, and point your best people at the clients instead of the spreadsheets.
FAQ
Custom reporting dashboards for agencies — quick answers
What is a custom reporting dashboard for a marketing agency?
It's a branded web page, on your own domain and in your colors, that pulls live data from the platforms your clients care about — Google Ads, Meta Ads Manager, GA4, Search Console, CallRail — and displays leads, cost-per-lead, ROAS, rankings, and spend automatically. Each client gets a login to see current results any time, instead of waiting for a monthly PDF. It's built around how your agency defines success and you own it outright.
How much does manual client reporting really cost?
More than most owners think, because it hides inside salaries. At the BLS median wage of $37.00/hour for a market research analyst (May 2024) and a conservative 3 hours per client per month, a 15-client agency spends roughly 540 hours and about $20,000 a year assembling reports by hand — before counting the opportunity cost of pulling a skilled analyst off actual campaign work.
When is a custom dashboard worth it vs. keeping reports manual?
The tipping point is roughly where your annual manual-reporting labor approaches the one-time cost of a build, and where reporting has become a drag on the team or a risk to retention. For agencies with one to three clients, or clients on wildly different one-off stacks, a clean template is usually the better call. For a growing retainer book pulling from the same handful of platforms, a dashboard typically pays back within the first year.
Does better reporting actually improve client retention?
The data says yes. About 43% of clients are unhappy with their agency's reports, and agencies that delivered consistent data-backed proof-of-performance reporting saw retention climb 51% over 24 months (Vendasta). Since 50% of marketing decision-makers have fired an agency in the last two years — mostly over perceived results and communication (HubSpot) — a report clients can actually see and understand is direct churn protection.
How long does it take to build a custom reporting dashboard?
A client reporting dashboard typically takes about 4–6 weeks. Because we build with Claude Code — Anthropic's AI-assisted development CLI — a small senior team ships roughly 10x faster than a traditional dev shop. Fixed-price projects run $3K–$50K+ depending on scope, or $75/hour on an hourly retainer, and every fixed-price build includes a 30-day bug-fix warranty.
Can the dashboard connect to GoHighLevel?
Yes. If you want to combine ad and analytics data with pipeline, lead, and attribution data from GoHighLevel, that's a GHL development build that runs alongside the standalone dashboard. Many agencies need both — a client-facing reporting dashboard and a GHL integration feeding it — and we handle each. Book a scoping call and we'll map exactly what your reporting needs to read from.
Written by Marisa Quintero, Agency Operations Strategist. Marisa spent eight years running fulfillment for a 40-client SEO and PPC shop before going independent, and is obsessed with the boring half of agency life — onboarding, reporting cadences, and retainer renewals — because that’s where margin quietly leaks out. Based in Austin, TX.
Related reading: Stop Client Churn With Automated Reporting · The White-Label Client Portal Guide · Lead Attribution That Proves ROI · Digital Marketing Agency Benchmarks 2026