
It is the last Friday of the month and two numbers do not agree. Revenue looks fine. The bank balance looks fine. But your team says they are slammed, you are turning down a project because “we have no capacity,” and the margin at the bottom of the P&L is thinner than last quarter. Everyone is busy. Nobody is profitable. That gap has a name, and it is billable utilization.
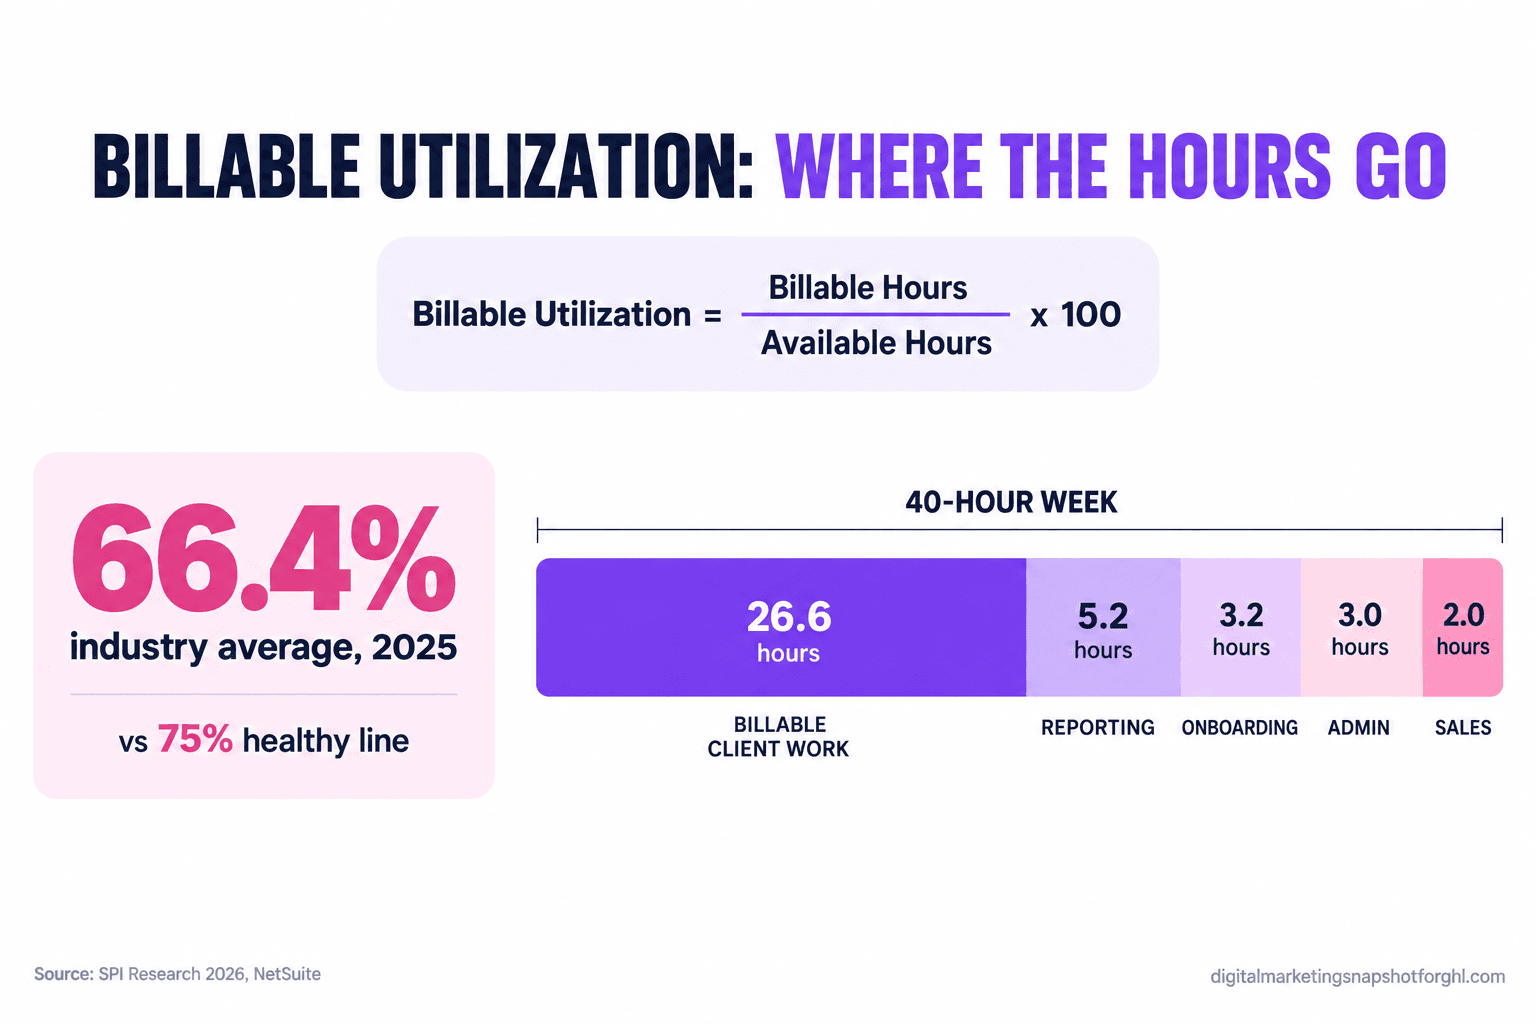
Here is the short version. Billable utilization is the share of your team’s available hours that get billed to clients, and you calculate it as billable hours divided by available hours times 100. The healthy line is around 75%, most firms run well under it, and the fastest way to lift it is not to make people work more hours. It is to move the non-billable hours (reporting, onboarding, admin, chasing) off your senior people and onto systems.
What this article covers
- What billable utilization actually is
- What low utilization is costing you
- How to calculate it correctly
- The 2026 benchmark by role and size
- The six-stage system to lift it
- Three scenarios: solo, 11-20, and 20-plus
- Steal this: the tracking setup and review script
- Objections
- FAQ
What billable utilization actually is (and what it is not)
Billable utilization answers one question: of all the hours you pay a person to be available, how many did you invoice a client for? If a strategist is available 160 hours in a month and logs 112 hours to client work, that is 70% billable utilization (NetSuite).
It gets confused with two other numbers, and the confusion costs you money.
Resource utilization counts all worked hours, billable or not. A person can be at 95% resource utilization (flat out) and 55% billable (most of it internal). Busy and billable are not the same thing. Realization is different again: utilization is whether the hour got billed, realization is whether you collected full rate for it rather than discounting or writing it off (Bennett Financials). You can bill an hour and still lose money on it.
For an agency, “billable” is any hour a client pays for, hourly or retainer. Even on a flat retainer it matters: deliver 60 hours on a 40-hour retainer and your effective rate is collapsing, and you will not see it until the account feels unprofitable.
What low utilization is quietly costing you
Low utilization moves everything downstream: revenue, margin, hiring plans, and how close your best people are to quitting. Billable utilization across professional services firms fell to 66.4% in 2025, the lowest figure in the history of SPI Research’s survey, which covers more than 500 firms, and it sits under the roughly 75% line the industry treats as healthy (SPI Research 2026 Professional Services Maturity Benchmark, via Certinia). The same benchmark shows the split clearly: high-performing firms held 75.0% utilization while everyone else averaged 64.9%, and firms at the top maturity level reached 81.2%.
Put a dollar figure on it. Say you run a five-person delivery team, each fully loaded at $80,000 a year: $400,000 in capacity you pay for, so every point of billable utilization is worth about $4,000 a year in billed work. Moving that team from 65% to 72% is roughly 28,000 dollars of revenue you already have the payroll to deliver, without hiring anyone or winning a new client.
The trap is that low utilization hides behind a busy team. The hours are worked. They just go to reporting nobody reads, onboarding that takes three weeks, scope creep you never billed for, and internal meetings. The work feels productive. The invoice does not reflect it.
How to calculate billable utilization correctly
The formula is simple; the inputs are where agencies go wrong.
Billable utilization = (billable hours ÷ available hours) × 100 (Asana, 2026).
Billable hours are only the time a client pays for: strategy, execution, calls, in-scope revisions. Not internal syncs, not pitching, not fixing your own systems.
Available hours are the part people fumble. They should exclude approved time off and holidays. Divide by a flat 2,080 hours a year while your people take three weeks of leave and utilization reads artificially low, so you make bad hiring decisions off it. Available means “hours the person was actually on the clock and able to work.”
A worked example for one strategist in a month:
- Total workdays: 22 (176 hours at 8 hours a day)
- Approved time off: 1 day (8 hours)
- Available hours: 168
- Billable hours logged: 118
- Billable utilization: 118 ÷ 168 = 70.2%
Track it weekly per person, roll it up monthly per team, and review the trend quarterly. A single month is noise; the direction over a quarter is the signal.
The 2026 benchmark, by role and by agency size
“Aim for 75%” is true at the agency level and useless at the person level, because a paid-media specialist and a client-facing account director should never carry the same target. Blend them and you burn out the specialist while the account manager coasts. Here is what good looks like by role, drawn from current agency benchmarks (Runn, Growth Rocket, Productive):
| Role | Healthy billable target | Why |
|---|---|---|
| Junior / production specialist (SEO, PPC, content, design) | 80 to 85% | Almost all their time is client work |
| Mid-level specialist / strategist | 75 to 80% | Some planning and internal time is expected |
| Account manager | 65 to 75% | Relationship and coordination time is non-billable |
| Anyone who also sells, hires, or trains | 60 to 70% | Selling and managing is not billable |
| Owner-operator (solo) | 60 to 70% | You run and deliver at the same time |
Billable utilization, 2025, by firm performance tier. Source: SPI Research 2026 Professional Services Maturity Benchmark, via Certinia.
The other half of the benchmark is the ceiling. Pushing sustained utilization above 85% reads like a win and behaves like a countdown: no slack for training, pitching, thinking, or the week a client blows up. Firms that chase 100% tend to get less profitable over time, because the people who deliver the work start leaving (Runn). The target is a band, not a maximum, and roughly 70 to 80 percent blended is the profitable, sustainable zone.
The six-stage system to lift utilization
You lift utilization one of two ways: bill more of the hours you have, or reclaim the hours you waste. Overtime is the tempting third option and a trap, because it inflates the denominator, burns your team, and reverses the moment people push back. Work these six stages in order.
Stage 1: Measure honestly before you change anything
You cannot lift a number you are guessing at. Get every delivery person logging time to client codes for two weeks, split billable from non-billable, and build a real baseline by person and role.
How it breaks: people hate timesheets, so they backfill Friday from memory and the data is fiction. Fix it by making logging take seconds (timers, not spreadsheets) and never using the numbers to punish an individual. The moment time tracking becomes a surveillance tool, the data dies.
Stage 2: Attack the three big non-billable sinks
Three categories eat most non-billable time: client reporting, onboarding, and admin/status chasing. They are recurring and they land on your most expensive people, so they are the best hours to reclaim. Reporting is usually the biggest: a specialist spending a full day a month building decks nobody reads is at lower utilization for no client value. Automate the report and that day converts to billable capacity. We covered this in how to stop client churn with automated reporting, and the tool-cost angle in AgencyAnalytics alternatives that do not charge per client.
How it breaks: agencies automate the report but keep a senior person “reviewing and tweaking” it for an hour every time, quietly rebuilding the sink. Automate the whole loop, not the first 80%.
Stage 3: Close the scope-creep leak
Scope creep is billable work you give away, so it reads as low utilization because those hours never reach an invoice. The fix is a scope of work that names deliverables, revision rounds, and a clear “this is extra” boundary, plus logging out-of-scope requests the moment they arrive.
How it breaks: the boundary exists on paper but nobody enforces it, because saying no to a client feels risky. Give your team a pre-written, friendly message (see Steal this) so the boundary is a copy-paste, not a confrontation. Tighter retainer structure helps too, which we broke down in how to price marketing agency retainers.
Stage 4: Right-size the team and the bench
If one specialist is at 90% and another is at 50%, you do not have a utilization problem, you have an allocation problem. Rebalance the book of work before you hire. Only sustained over-capacity (the whole team above 80% for a quarter) justifies adding a head.
How it breaks: owners hire off a single busy month and carry the cost through the next slow one. Look at the quarter, not the week.
Stage 5: Protect focus and batch the shallow work
Fragmented days kill billable output. Five 30-minute gaps between meetings are not billable, but a protected three-hour block is. Batch internal syncs, cluster client calls, and give people real maker-time.
How it breaks: “just a quick call” culture. Defend the blocks like client meetings, because they are.
Stage 6: Put utilization on a review cadence
What gets reviewed gets managed. Add utilization to a weekly ops check and a monthly review, watch the trend by role, and act on it. A number you look at once a quarter is one nobody owns.
Three scenarios: what to do at your size
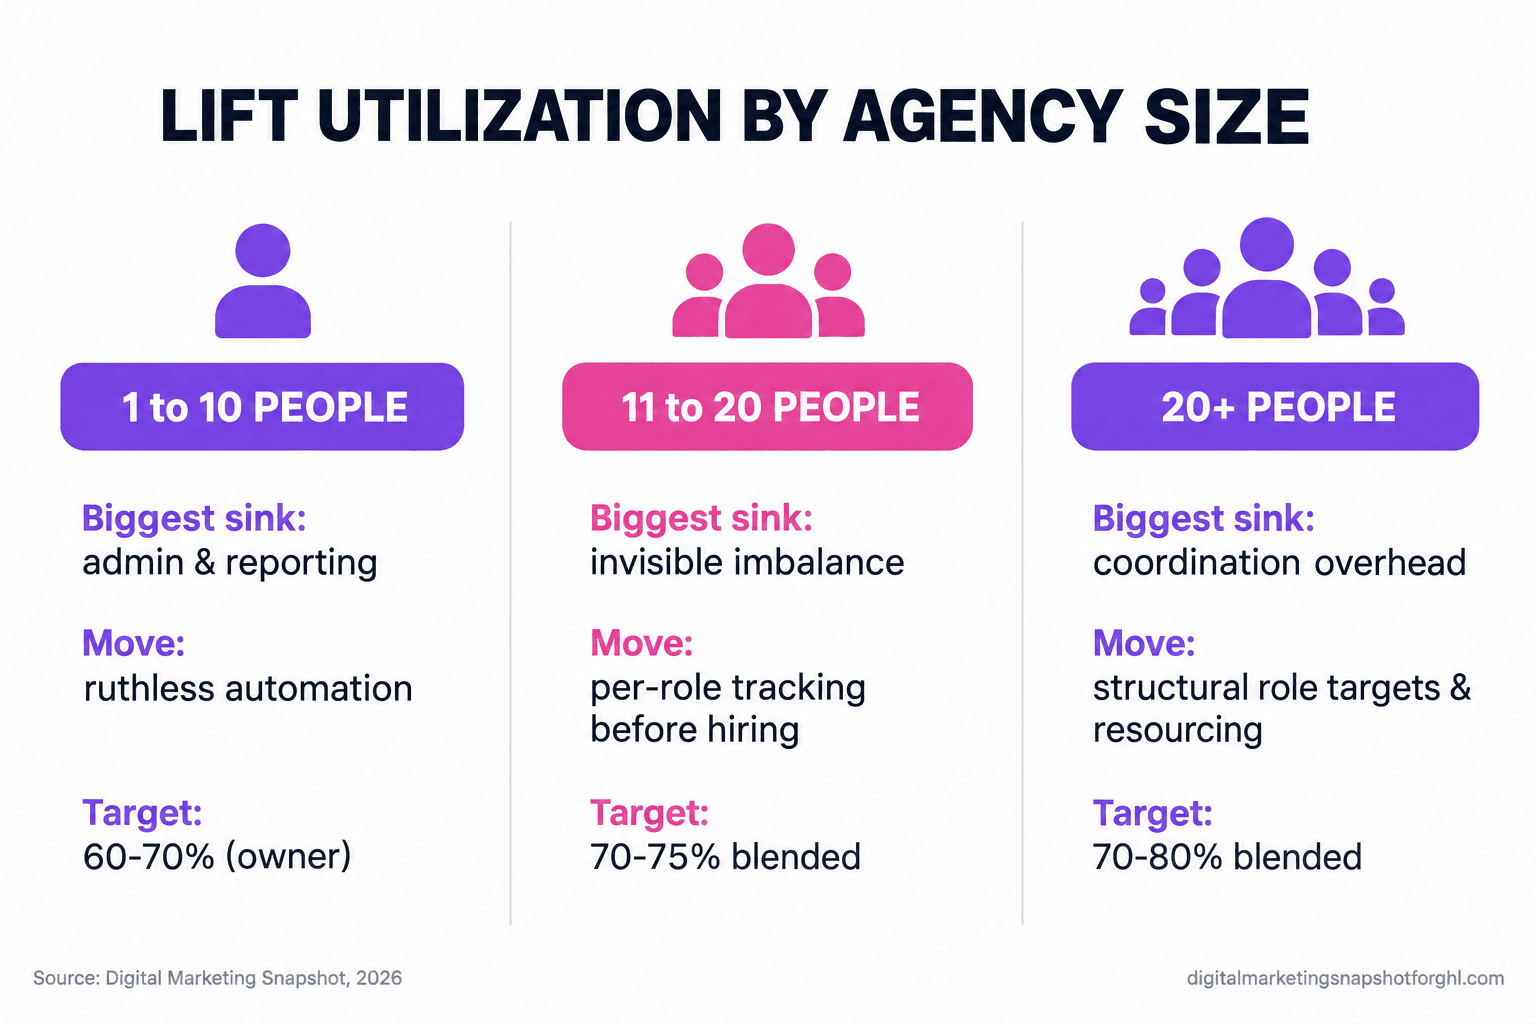
The right move depends on how big you are, because the biggest sink changes as you grow. This is the agency-size axis, and it matters more than any single tactic.
Solo operator or 1 to 10 people
You deliver and run the business at the same time, so your own utilization is low by necessity, and that is fine. A working owner at 60 to 70% billable is healthy, so do not measure yourself against an 80% target and feel like a failure. The lever is ruthless automation of admin and reporting, because you have no one to delegate to, and automating onboarding is the highest-return move at this size (onboarding clients in minutes, not weeks). A VA for the shallow work is often cheaper than your own time, which is the logic behind hiring a GoHighLevel VA.
11 to 20 people
This is where utilization goes invisible. Too big to eyeball who is busy, too small to have an ops person watching it, so a blended number hides a burning-out specialist and a coasting account manager in the same report. Your move is per-role tracking and rebalancing before hiring, because you almost certainly have hidden capacity in the wrong hands. Reporting and status admin scale faster than headcount here, so systematizing them protects margin as you grow (scaling an agency without adding headcount).
20-plus people
Now the enemy is coordination overhead. Every new person adds communication cost, and internal time creeps up faster than billable time. Your levers are structural: clear role targets, a real resourcing process, protected focus time as policy, and utilization reviewed at the team-lead level. Small percentage gains are large dollar figures here. If your tooling has become the coordination tax, read the 2026 agency management software pricing teardown before you renew.
Steal this: the utilization setup and the weekly review
Here is the scaffolding, ready to copy. This is the part to bookmark.
The billable / non-billable category list. Give your team this split so logging is unambiguous:
- Billable: client strategy, execution and production, client calls and check-ins, in-scope revisions, in-scope research, client-specific reporting time if the retainer explicitly includes it.
- Non-billable: internal meetings, pitching and proposals, your own admin, tool setup and maintenance, generic reporting, training, PTO (excluded from available hours entirely).
The weekly ops review agenda (15 minutes). Run this every Monday:
- Blended utilization last week, and the trend over four weeks.
- Anyone above 85% two weeks running (rebalance before they burn out).
- Anyone below their role target two weeks running (allocation or pipeline problem).
- Total non-billable hours by category (which sink is growing).
- One owner, one action for the week. Just one.
The scope-creep boundary message (copy-paste for your team). Scope creep goes unbilled because saying no feels awkward, so hand your team the words:
“Happy to take this on. Quick heads-up that it sits outside what we scoped for this month, so I will send a short add-on estimate before we start rather than pull it from your current hours. Want me to send that over?”
Sent in the moment, that recovers more billable hours than any timesheet policy, because it turns invisible give-away work into a real invoice or a clear no. Put two numbers on a wall the team can see: blended utilization this month, and the trend arrow versus last month.
Reclaiming utilization: manual grind vs systematized ops
| Plan | The manual grind | Systematized opsRecommended |
|---|---|---|
| Price | Senior time, every month | Built once, runs on autopilot |
| Feature 1 | Reports built by hand, per client | White-label reports sent automatically |
| Feature 2 | Onboarding stretched across weeks | Onboarding automated from day one |
| Feature 3 | Scope creep noticed after it is given away | Out-of-scope requests flagged in the moment |
| Feature 4 | Utilization guessed at, reviewed rarely | Utilization tracked by role, reviewed weekly |
| Feature 5 | Growth means more admin, not more margin | Growth converts to billable capacity |
| See how it's built → |
Objections, answered
“My team is already flat out. There is no more to squeeze.” That is the signal this is a utilization problem, not a capacity one. Flat out and billable are different numbers. If everyone is busy and margin is thin, much of that busy is non-billable, and the fix reclaims hours you already pay for.
“Timesheets will kill morale.” They will, if you use them to police people. They will not, if logging takes seconds and the numbers fix workload imbalance and kill busywork. Frame it as “we are going to stop making you build reports by hand,” not “we are going to watch your hours.”
“I bill flat retainers, so utilization does not apply to me.” It applies more. On a retainer, utilization is how you catch an account that is quietly unprofitable before it drags down the agency. A 40-hour retainer soaking up 60 hours of delivery only shows up here.
“Automating reporting feels impersonal.” Clients want the insight and the response, not the manual assembly of a slide deck. Automate the production, keep the human on the interpretation and the strategy call.
“We are too small to worry about this.” Small is when it matters most, because at 1 to 10 people every reclaimed hour is a meaningful slice of your total capacity. The habits you build now are what let you scale without the margin collapse most agencies hit at 15 people.
FAQ
Billable utilization: quick answers
How do you calculate billable utilization?
Divide billable hours by available hours and multiply by 100. Billable hours are only time a client pays for; available hours exclude approved time off and holidays. A strategist with 168 available hours who logs 118 billable hours is at 70.2%.
What is a good billable utilization rate for a marketing agency?
Roughly 75% blended is healthy, and 70 to 80 percent is the sustainable zone. It varies by role: production specialists 80 to 85 percent, account managers 65 to 75 percent, and anyone who also sells or manages 60 to 70 percent. Sustained rates above 85 percent are a burnout warning, not a target.
What is the current industry benchmark for utilization?
It fell to 66.4% in 2025, the lowest in SPI Research's survey history, against a roughly 75% healthy line. High performers held 75.0% while everyone else averaged 64.9%, and top-maturity firms reached 81.2% (SPI Research 2026 Professional Services Maturity Benchmark).
What is the difference between utilization and realization?
Utilization is whether an available hour got billed. Realization is whether you collected full rate for it, rather than discounting, writing it off, or absorbing it under a fixed fee. You can have high utilization and low realization, billing hours without making money on them. Track both.
How do I raise utilization without overworking my team?
Do not add hours, reclaim wasted ones. The three biggest non-billable sinks are reporting, onboarding, and admin, and all three automate. Then close scope creep so give-away work gets billed, rebalance work before hiring, and protect focus blocks. Overtime just inflates the denominator and reverses the moment people push back.
The bottom line
Utilization is the growth lever most agencies own and never pull. You pay for the capacity. The only question is how much of it reaches an invoice. Get the number honest, break it out by role so the average stops lying to you, and go after the non-billable drag (reporting, onboarding, admin, scope creep) instead of asking anyone to work more.
Do that and the last-Friday feeling changes. The team is busy, the number is climbing, and the margin finally agrees with how hard everyone worked. That is what a healthy utilization rate buys you: not a harder-working agency, a better-paid one.
Related reading: how to price marketing agency retainers, scaling an agency without adding headcount, and automated reporting that reduces churn.