
It is 9:15 on a Sunday night. The kids are down, and you are at the kitchen table with eleven browser tabs open. Google Analytics, Meta Ads Manager, the call-tracking dashboard, a half-built deck with last month’s logo still on slide one. You are not doing the work a client pays you for. You are assembling proof that you did it, and you will do it again at month-end for every client on the roster.
Here is the part that stings. One report is not the problem. The multiplication is. Most agencies finish a single client report in under an hour. But you do not have one client, you have a dozen, each on a different mix of platforms, each wanting it monthly, and the stack lands on the one person who cannot delegate it: you. That is why reporting does not feel like an hour. It feels like a weekend.
This is the fix. Not a tool, a system: six stages that move reporting off your Sunday, with the real copy to paste in, where each stage breaks, and how the math changes by team size.
What this article covers
- Why reporting feels bigger than it measures
- What it is actually costing you
- The six-stage system, start to finish
- Steal this: the copy that makes a report land
- Three scenarios: solo, ten-person, twenty-plus
- A word on client data and compliance
- Objections, answered straight
- FAQ
Why reporting feels bigger than it measures
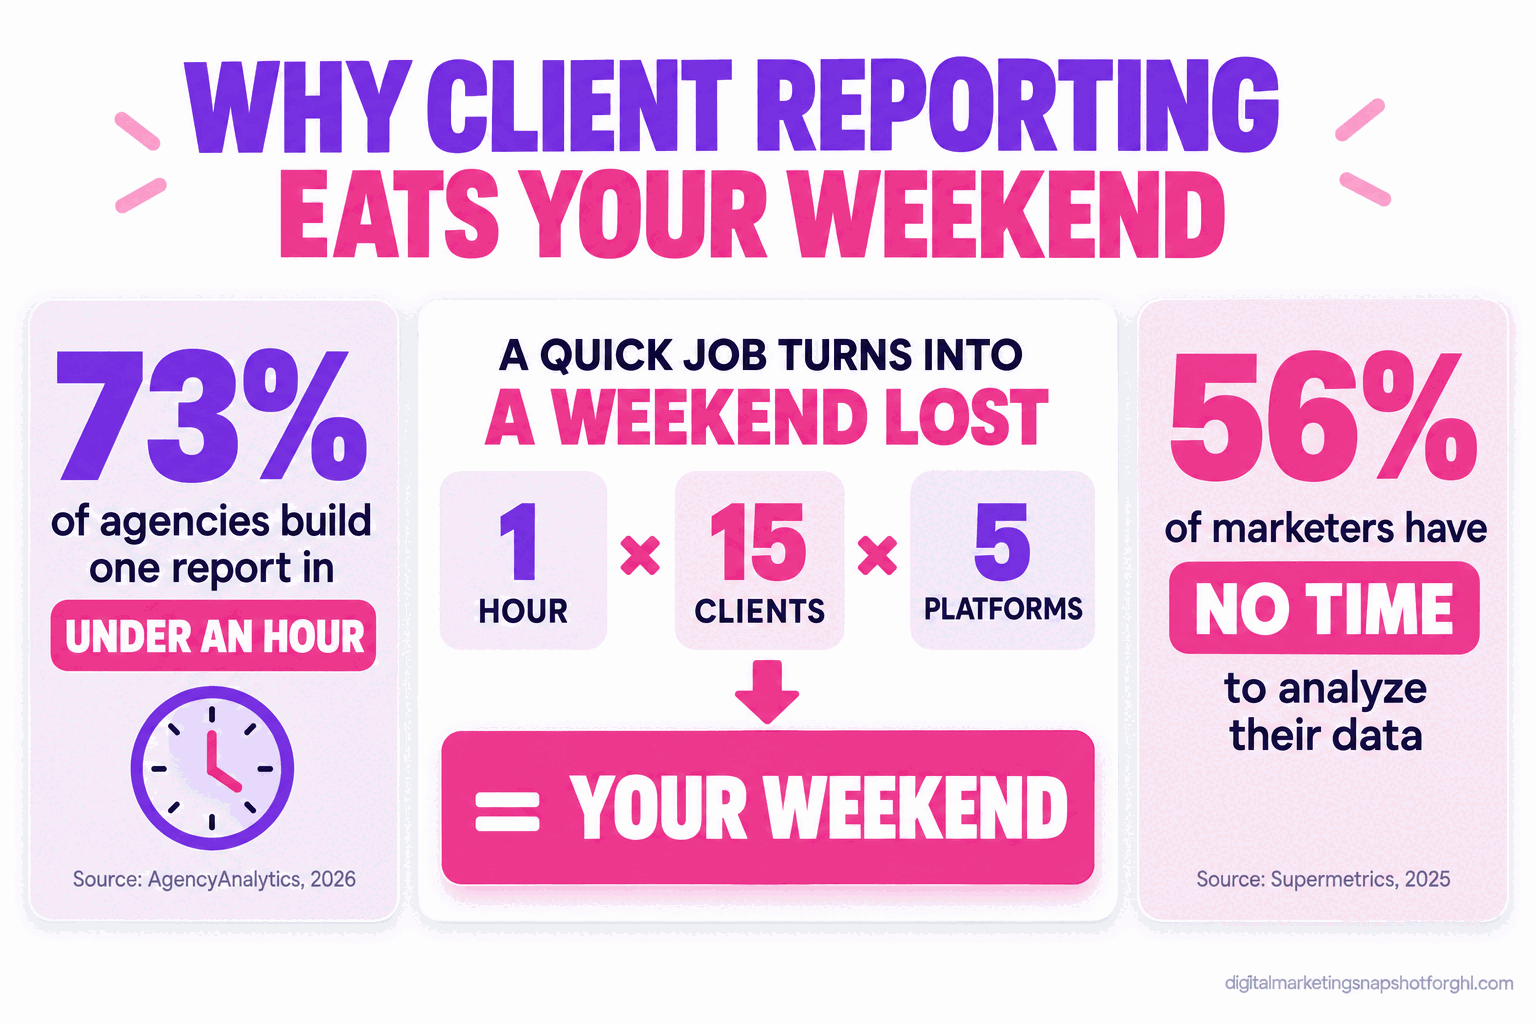
Ask an agency owner how long a client report takes and they underestimate, because they are picturing one report. In AgencyAnalytics’ 2026 survey of 494 agency professionals, 73% complete a report in under an hour, and only 4% take more than three (AgencyAnalytics, 2026). On paper, reporting is a quick job.
How long agencies spend building a single client report. Source: AgencyAnalytics 2026 Marketing Agency Benchmarks (494 agency professionals).
So why the weekend? Three multipliers the per-report number hides. Clients: an hour is fine for one, but fifteen retainers is fifteen hours a month of pure assembly, and the founder usually absorbs it. Platforms: a full-service client is rarely on one channel, so SEO, paid search, paid social and call tracking are each a separate login and export, and every join is a chance to fat-finger a figure. Cadence: it is not monthly and done, it is the month-end deck, the mid-month check-in, and the ad-hoc “can you pull last week’s numbers” on a Thursday.
Stack those three and the quick job becomes the thing you dread. And because it is quick per unit, it never feels worth systematizing, so you keep doing it by hand.
What it is actually costing you
The minutes are the smallest part of the bill. Three costs run deeper.
The analysis never happens. When the hour goes on assembly, nothing is left for the part that keeps the client: telling them what the numbers mean. 56% of marketers say they do not have time to analyze their data thoroughly (Supermetrics, 2025). The report ships as a data dump, so the client skims it and files it.
The value stops being visible. Smartsheet’s 2025 Pulse of Marketing Report found 94% of marketing professionals struggle to demonstrate the business impact of their work (Smartsheet, 2025). If you cannot make the impact obvious, the client wonders what they pay for.
Clients leave. In the same AgencyAnalytics survey, “lack of perceived value over time” was the third most common churn reason, cited by 32% of agencies, behind budget cuts (42%) and client-side changes (37%). It is the one churn reason you fully control (AgencyAnalytics, 2026). A report that does not land is a slow leak in the retainer.
A fourth cost hits margin. Reporting is non-billable work that lands on your most expensive people. Billable utilization across professional services firms fell to 66.4% in 2025, the lowest in SPI Research’s history (SPI Research, 2026), and every hour a strategist spends copy-pasting into a deck drags that down (billable utilization playbook). At the U.S. average agency rate of about $115 an hour (DesignRush, 2025), four hours a week of senior reporting time is close to $2,000 a month of capacity you did not bill or sell.
The six-stage system, start to finish
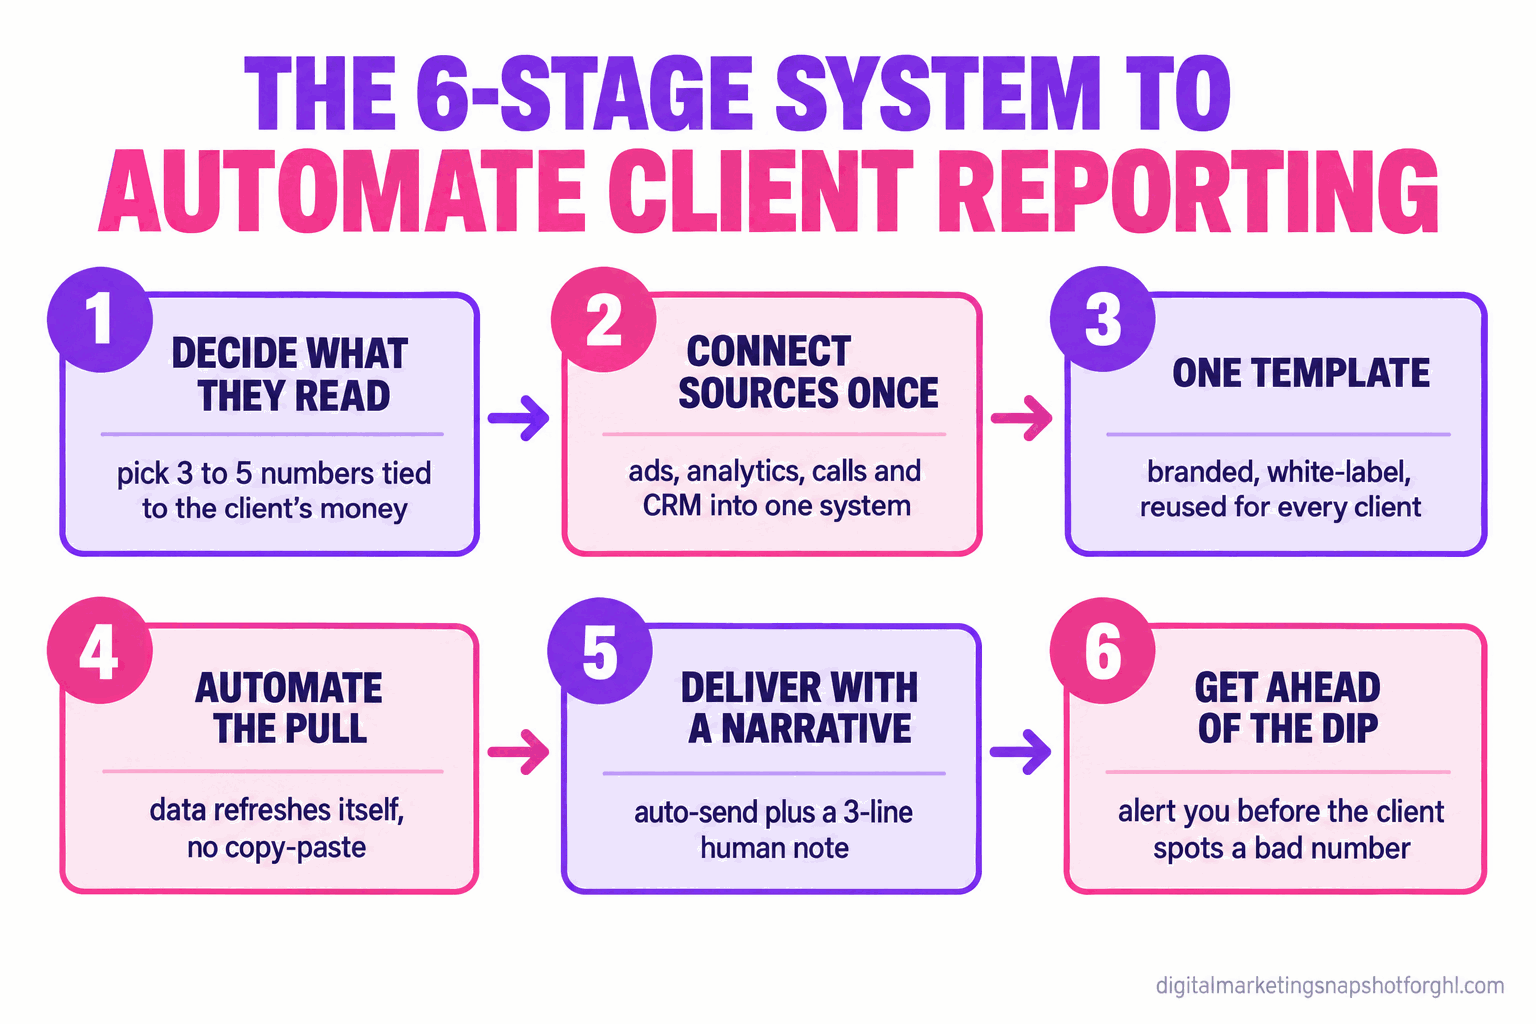
You do not fix reporting by working faster. You fix it with a system that collects once, formats once, and delivers on a schedule, so the only human job left is the insight. Work them in order.
Stage 1: Decide what the client actually reads
Before you touch a tool, cut the report to what the client cares about. Most reports fail because they show everything: impressions, reach, bounce rate, a keyword table nobody opens. The client wants three to five numbers that map to their money: leads, cost per lead, booked calls or sales, and the trend versus last month. Get this at onboarding, not by guessing.
How it breaks: you keep adding metrics because a client once asked about one, and the report bloats back to a dump. Treat the core numbers as fixed and park everything else in an always-on dashboard.
Stage 2: Connect every data source once
The copy-paste marathon exists because your data lives in a dozen places. Pull every source into one system a single time: website analytics, Google and Meta ads, call tracking, email, and the CRM where leads land. Then the numbers flow on their own. A platform that already holds your CRM and calls has an edge here, because the leads it tracks are the numbers the client cares about most. We mapped the options, including the ones that do not charge more every time you win a client, in AgencyAnalytics alternatives that do not charge per client.
How it breaks: connections expire. A client resets a password, a token times out, and next month three reports quietly show stale or zero data. Check connection health on a schedule, not when a client emails to ask why their leads dropped to nothing.
Stage 3: Build one template, not eleven decks
Every client does not need a bespoke design. Build one branded template with your logo and the client’s, a fixed structure, and placeholders for the core numbers. Then every report is that template with their data in it. The report should look like it came from the client’s own team, the same rule we apply in the white-label client portal guide.
How it breaks: one client asks for a custom section and you fork the template, then another does, and six months later you maintain eleven near-identical templates again. Make custom requests additive, a module you bolt on, never a reason to rebuild.
Stage 4: Automate the pull and the refresh
With sources connected and a template built, the data should populate itself on a schedule. No export, no paste, no screenshot. This stage gives the hours back, because it removes the assembly.
How it breaks: agencies automate 80% of it, then keep a senior person “reviewing and tweaking” for an hour before it ships, quietly rebuilding the sink they tried to drain. Automate the whole mechanical loop and leave only the narrative in Stage 5 to a human.
Stage 5: Deliver on a schedule, with a narrative
This is the stage that keeps clients. A report with no story is a dump, which is why 94% of marketers struggle to show impact. So the report goes out automatically on the same day each month, carrying a short human note on top: what we did, what it means for your business, what we are doing next. That note is the value, and it is the only part you write by hand.
How it breaks: the numbers go out but the note does not, so the client gets a cold PDF and draws their own conclusion from a dip they do not understand. Treat the narrative as the deliverable and the numbers as the attachment. The copy is in Steal this.
Stage 6: Handle the “why did this drop” question first
The client should never be the first to spot a bad number. An alert should reach you before they open the dashboard, so you explain the dip before they ask. “Heads up, leads dipped last week, here is why and here is what we changed” turns a worry into a reason to trust you.
How it breaks: there is no alert, so the client finds the dip on a Saturday and you are explaining on the back foot on Monday. Fix it with a threshold alert and a pre-written template so the reply is a two-minute edit. Proving the “why” behind a number is what lead attribution that holds up is for.
Steal this: the copy that makes a report land
The system removes the assembly. This copy handles the part that keeps the client. Change the names and use it.
The onboarding question (ask it before the first report).
“Six months from now, what has to be true for you to feel this was money well spent? Give me the one or two numbers you would point to. We will build your report around those and keep the rest out of your way.”
That tells you which numbers belong in the headline and makes the client a co-author.
The monthly report delivery email.
Subject: Your [Month] report, the short version
Hi [First name], full report attached. Here is the 30-second version.
What we did: Launched the new landing page and shifted 30% of budget to the search campaigns that convert.
What it means for you: Booked calls were up 18% month over month at a lower cost per call. That is 11 extra qualified calls.
What is next: Scaling the two ad sets that drove those calls and testing a new offer on the slower one.
Want to talk any of it through? Grab a time here: [link].
The three-part narrative note (top of every report). Keep these headers every month: What we did. What it means. What is next. Clients learn the shape, and the familiarity builds trust.
The “heads up” message (when a number moves the wrong way).
Hi [First name], quick heads up before you see it in the dashboard. [Metric] dipped last week, down about [X%]. The cause is [plain reason, e.g. “Google paused one ad for a policy review, now resolved”], not a drop in demand. We have already [action taken], and I expect it back to normal within [timeframe]. No action needed from you.
The scope note (when the ad-hoc “can you just pull…” lands).
Happy to pull that. Quick note so nothing slips: one-off pulls outside the monthly report sit in our add-on bucket, and I will fold a running view of [metric] into your standing dashboard so you can see it live. Want me to set that up?
That last one converts free Thursday pulls into billable work or a self-serve view. For building those boundaries into the retainer, see how to structure agency retainers to cut churn.
Three scenarios: solo, ten-person, twenty-plus
The system is the same; what changes is what you automate first.
The solo operator (three to five clients). Reporting competes directly with billable work, so your win is speed, not polish. Build one template, connect sources once, and auto-send every report on the same day with your three-line note on top. Skip the alerts for now. At five clients the monthly narrative is 20 minutes total. The trap is calling it “only a few reports” and never building the template.
The ten-person shop (ten to twenty clients). This is where manual reporting breaks hardest: the volume is real but you have no dedicated ops person, so the founder is still “reviewing” every report, the most expensive hour in the building. Your win is removing the founder from the mechanical loop. Automate the pull and delivery, let account managers write only the narrative, and set up threshold alerts, because at fifteen clients a broken connector hides in the pile until a client finds it. This is the size where lifting reporting off senior people moves your utilization most.
The twenty-plus agency (forty-plus clients). Hand-built reporting is already impossible, so the risk is consistency, not time. Forty clients means forty chances for a wrong number or a report that quietly stopped sending. Your win is a single enforced template, centralized connection monitoring, and a clear split between the automated report and the human quarterly review. At this scale, ten minutes saved per report is a full work week a month across the team. The broader version is in why agency margin shrinks as you grow.
A word on client data and compliance
Reporting moves data around: your client’s performance numbers, and often their customers’ contact details in the CRM behind them. If any of the client’s leads are in the EU, GDPR applies the moment that personal data lands in your dashboard or report. You are a data processor acting for your client, so you need a data-processing agreement with them, and you should limit who on your team sees raw contact-level data versus aggregate numbers. A report that leaks one client’s data into another’s deck is a breach, not a typo, and the single-template, automated-pull system reduces that risk, because manual copy-paste between clients is exactly how the wrong numbers end up in the wrong place. None of this is legal advice, but build the system so clean data handling is the default.
Objections, answered straight
“My clients want a real human, not an automated report.” They do, and this gives them more of one. Automating the assembly frees you to write the narrative and get on the quarterly call prepared, which is the human part that gets skipped today when you run out of time on the data. Strong relationships are what 80% of agency leaders name as the top retention factor (AgencyAnalytics, 2026), and automation buys the time to build them.
“Every client uses different platforms, I can’t template that.” The template is the structure, not the channels. The headers stay fixed, and the sources behind them differ per client without changing the layout. A local SEO client sees organic traffic where a paid-social client sees ad spend and booked calls.
“I already pay for AgencyAnalytics, isn’t reporting solved?” A dedicated tool solves the dashboard well. It does not solve the narrative, which is still on you, or the bill, which climbs every time you win a client because the pricing is per client. If reporting still eats your weekend despite the tool, it is the narrative and the ad-hoc pulls doing it. We laid out the flat-rate options in AgencyAnalytics alternatives that do not charge per client.
“Won’t an automated report feel like I’m phoning it in?” Only if you automate the wrong half. A cold PDF with no note feels that way; one that lands on time, sharp and branded, with a clear human read on top, feels like an agency that has its act together. Clients reward the insight and the reliability, not the manual labor behind the screenshots.
FAQ
How much time does client reporting really take agencies?
A single report is quick for most: in AgencyAnalytics' 2026 survey of 494 agency professionals, 73% build one in under an hour. The weekend problem is that same hour multiplied across every client, every platform, and the monthly cadence plus mid-month and ad-hoc requests. Fifteen clients on mixed channels can mean 15-plus hours a month of pure assembly.
Why does unshown value cause clients to leave?
Because the client cannot see what they are paying for. 'Lack of perceived value over time' is the third most common reason agencies lose clients, cited by 32% in AgencyAnalytics' 2026 benchmarks. Separately, 94% of marketers struggle to demonstrate the business impact of their work (Smartsheet, 2025). A data dump with no narrative is a value problem, and value problems end retainers.
What should a client report actually include?
Three to five numbers tied to the client's money: leads, cost per lead, booked calls or sales, and the month-over-month trend. Decide them at onboarding by asking which numbers the client would point to to call the engagement a success, then park everything else in an always-on dashboard. A short report that answers the client's question beats a twelve-page deck nobody reads.
Can I automate reporting without it feeling impersonal?
Yes, by automating the right half. Automate the data collection, the template, the pull, and the scheduled delivery, and keep the narrative human: a three-line note saying what you did, what it means for the client, and what is next. The automation removes the assembly that ate your weekend; the note is the part the client actually values.
How does reporting affect agency profit margin?
Reporting is non-billable work that lands on your most expensive people. Billable utilization across professional services firms fell to 66.4% in 2025, the lowest on record (SPI Research, 2026). At the U.S. average rate of about $115 an hour, four hours a week of senior reporting time is close to $2,000 a month of capacity you did not bill or sell. Moving it onto a system lifts both utilization and margin.
The weekend reporting ritual is not a discipline problem, it is a systems problem with a systems answer. Build the six stages, and the eleven tabs close for good. The only thing left on your Sunday is the reason you got into this business, which was never screenshots.